
The new year is here, and it has us asking, “Where does our money go?” Also, it’s time to hop back on the blogging wagon and what better way than to start with a post about this past year’s spending.
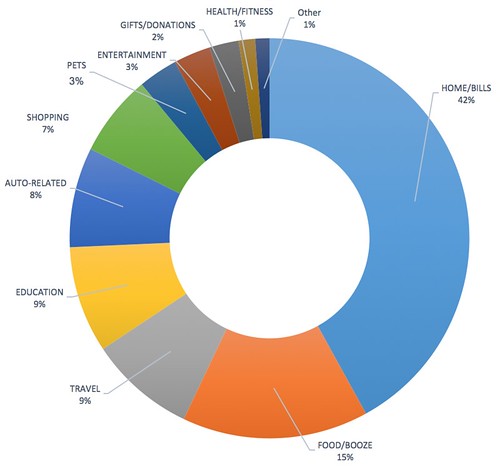
Home/Bills - Similar to last year, this is our largest area of spending. It includes mortgage, taxes, insurance, all house-related expenses, and bills. 42% this year compared to 35% last year means that we did a good job of not spending so much in other areas. For 2017, the goal is to continue to pay more in this category.
Food/Booze - We went from 17% to 15%! This is one of the categories that is a really high $ amount, but percentage-wise, it’s not really so much. We’re working on eating home-cooked meals more and spending less outside when we can. For lunch, I’ve signed up for a service called MealPal. It’s similar to a ClassPass for lunch. For a set $ amount, I can select a certain number of lunches from nearby restaurants in a month. The plan I’m currently on averages $7/lunch, which is relatively inexpensive when one considers how much lunches can cost in the area.
Shopping - We went from 9% to 7%. This category includes clothing rental and all my random spending. Good to know that it went down this past year. Sometimes it’s hard not using shopping as therapy, but I’m working on not getting to trigger happy when it comes to buying what’s in my online shopping cart.
Education - We went from 8% to 9%. These are those unavoidable student loans that we are working on getting paid off. The goal was to increase the percentage in this category because it meant we’re paying off more of the loans. Looks like that worked! With a strict spending plan, it’s possible we’ll knock these out this year. Fingers crossed!
Travel - We went from 7% to 9%. I think we were able to shift some of our spending from other categories to this one. It’s likely to go up in 2017 though since we no longer have Southwest Companion Pass status. However, we’re always on the lookout for good travel deals, so who knows where we’ll land in this category?

Auto-related - We went from 3% to 8%. The significant increase in this area is due to my new job. Since I now work a block away from Ryan, we commute together. We pay monthly for a parking spot, which is probably the main increase in this category. Fuel actually costs less than before since we drive a shorter distance, but parking in San Francisco is not cheap. However, we managed to secure a spot inside a residential building that was a better deal than all the other spots out there. Fingers crossed that they don’t raise the rent on us once the lease is up.
Pets - We went from 6% to 3%. The largest chunk of the costs in this category is pet insurance and doggie daycare expenses. Doggie daycare expenses dropped quite a bit since Fresca now commutes with us to work daily.

Entertainment We went from 5% to 3%. I still jump at the chance to get out and do fun things, but I’ve been more careful on the price tags of those fun things. Reducing here means increasing in areas that we’ve deemed more important.
Gifts/Donations - We went from 3% to 2%. Since we opted to spend more in other categories, I was a little pickier on where I was making my charitable donations. I have a feeling this will go up in 2017 as I’ll likely want to maximize on my employer’s matching policy. And that’s our pie chart for 2016. Looks like we did a pretty good job this past year, and I’m hoping we continue that trend throughout 2017.
Have you tracked your spending for the year? Are there areas of spending that you would like to change for the upcoming year?