
Most of 2018, I tracked my spending, and when it came to the end of the year, it was no different. As always, there’s room for improvement on where my spending landed. Here’s the annual comparison of spending % by category.
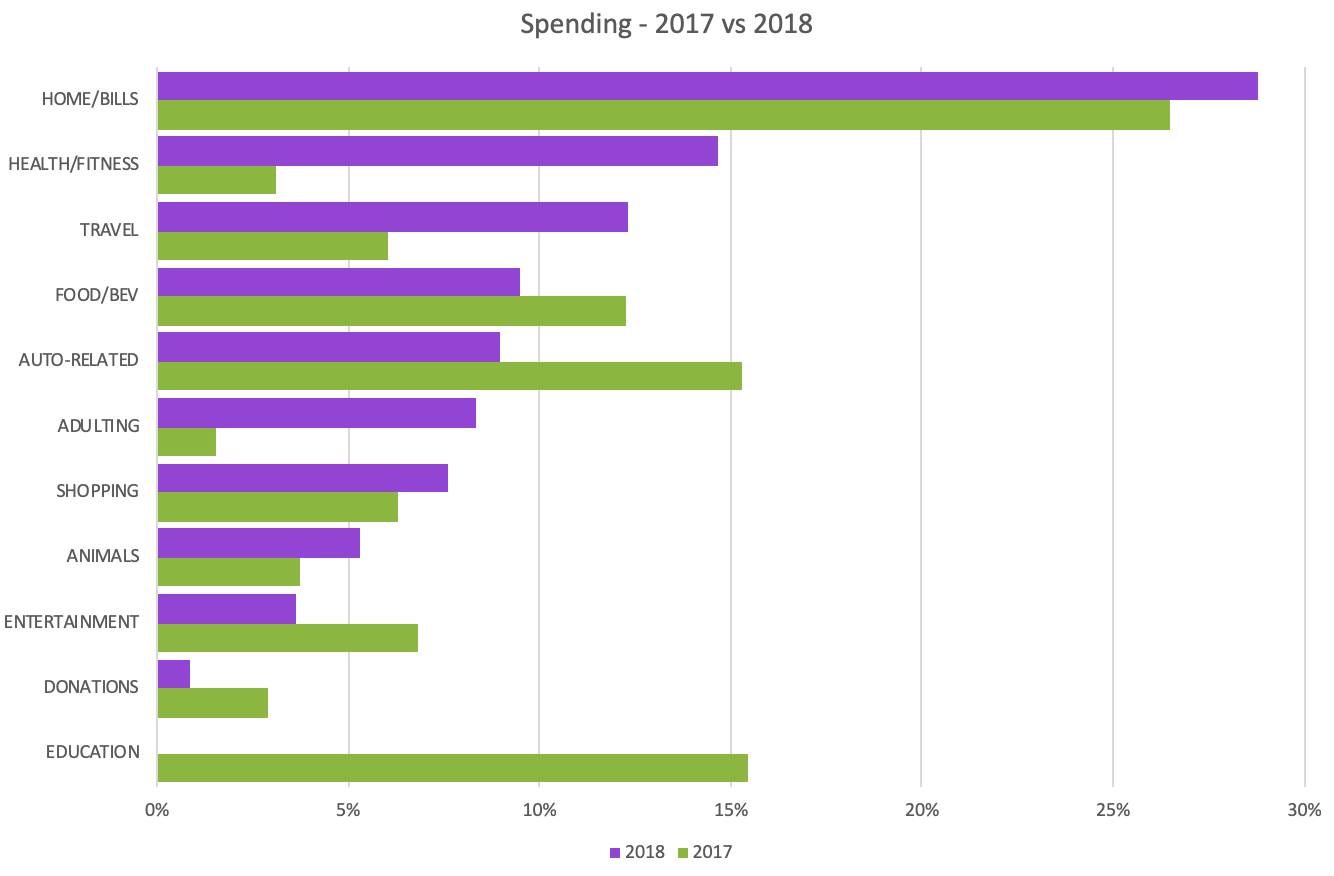
At a glance, there were major shifts in where our money was going. We paid off Ryan’s student loans in 2017, which gave us a bit to spread across other categories in 2018. Where did we move those funds? Health/fitness saw the biggest jump, followed by a category I like to call “Adulting,” which covers financial planning, estate planning, taxes and other “adult” decisions.
Health/Fitness (3% to 15%; 12% increase) 2018 was our year of health and fitness. For an entire year, we made that our priority, both in time and money. We had a personal trainer whip us into shape 2-3 times a week for an entire year. It was $$$ but worthwhile because in the end, we’re so much stronger than when we started, and we have the know-how to keep ourselves fit.
Adulting/Taxes (2% to 8%; 6% increase) - In May, we met with a financial planner. Later, we met with a lawyer for estate planning. As our lives become more complex, we’re seeking outside help here and there to make sure we are making all considerations. For 2019, we will be going to someone for tax guidance.
Travel (6% to 12%; 6% increase) - Part of the increase is due to how I changed the way I tracked meals/drinks on trips. I’ve started including them in the travel budget line instead of food/bev. In 2018, we took a LOT of Disneyland trips and also managed to fit in two international trips (just like in 2017).
Those were the largest increases. What were the major decreases, other than the aforementioned student loan?
Food/Bev (12% to 9%; 3% decrease) - I think most of this change is really in how I’ve been tracking consumption during travel. We don’t usually eat out much when we’re at home, but nearly every meal when we are traveling is eaten out.
Transportation (15% to 9%; 6% decrease) - In 2017, we were commuting downtown with the pup and parking in lots near our offices. With Ryan starting a new job in March that did not allow dogs in the office, we took the bus instead.
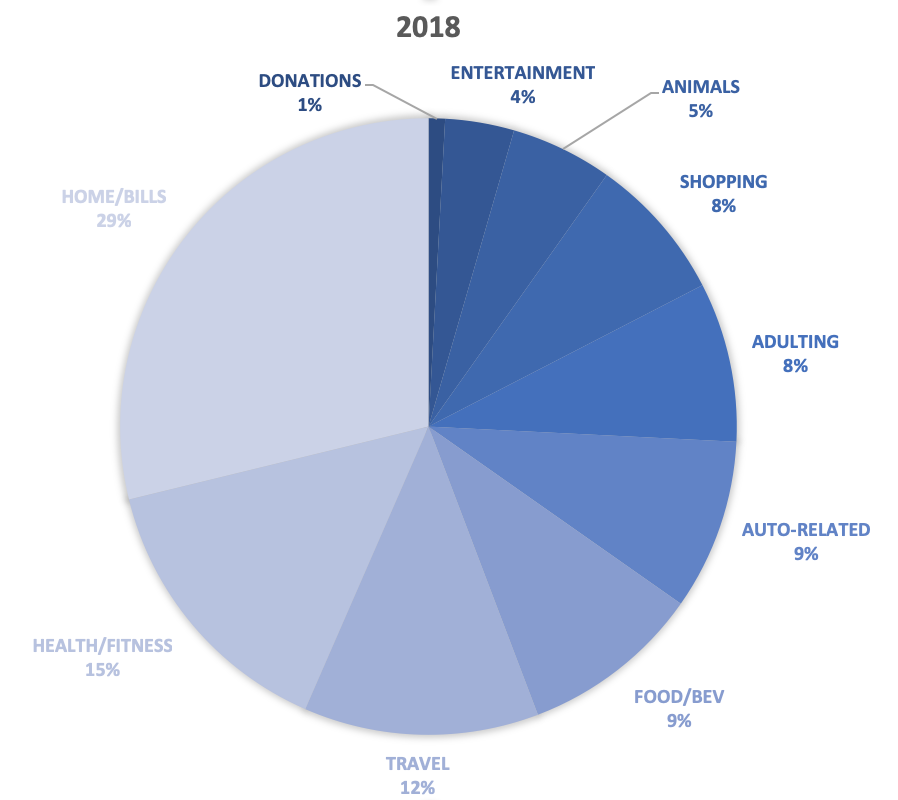 Here’s the pie for the year!
I’ve excluded savings from the charts above, but overall we’ve spent 7% less (comparing dollar to dollar) and saved 4% more.
For those of you wondering, I am using You Need A Budget (or YNAB for short) to track everything. If you have been curious on trying it out, here’s my referral link for a one month trial.
Are you tracking your spending? Any surprises from the past year? What are your spending goals for this year?