
The new year is here, and it’s time to review our prior year spending. New year means a chance to restart this blog yet again.
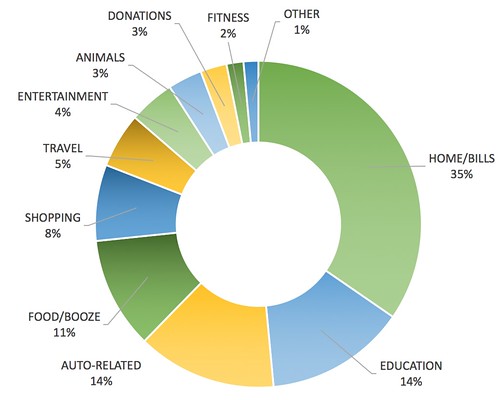
Home/Bills - The largest part of our spending includes mortgage, taxes, insurance, all house-related expenses, and bills. We’re back at our percentage from two years ago - 35%. It’s down from last year’s 42%. This surprised me since we have had quite a few larger house projects this past year. For 2018, the goal is to continue to pay more in this category as we’re making a bigger dent in the mortgage and also making other improvements.
Education - We finally finished paying off student loans. YAY! That’s why this category jumped to 14% from last year’s 9%. No student loans = pay more on the house and save more FINALLLY!
Auto-Related - Here’s another area that saw a significant increase - from 8% to 14%. We bought a new car in 2017 and continued commuting together. Our parking spot costs a little less per month than last year, but because we’re comparing a full year to less than half a year, there’s a big jump.

Food/Booze - We went from 15% to 11%, so this category is continuing a downward trend. This is one of the categories that is a really high $ amount, but percentage-wise, it’s not really so much in the grand scheme of things. We’re still eating home-cooked meals and trying to spend less outside when we can. For lunch, I’m still using MealPal for the days I’m not bringing my own food.
Shopping - We went from 7% to 8%. This category includes clothing rental and all my random spending. This is also an area that I’m expecting to go down in 2018 as I’m trying to be more intentional on purchases made.
Travel - We went from 9% to 5%. We have Southwest Companion Pass status again, so we’re saving on flights again. Even with the decrease in percentage, it’s not as if we’ve given up travel by any means. We took two international trips in 2017 - Cuba and Hong Kong - and filled in the gaps with a bunch of shorter domestic trips. We saw a whole lot of Montana this year (twice!), and next year, it’ll be a lot of Disney trips.
Pets - Fresca/Sergio expenses stayed at 3% for the year. This category consists of pet insurance,doggie daycare expenses, food, litter, and Barkboxes. Doggie daycare expenses dropped quite a bit since Fresca now commutes with us to work daily.
Entertainment We went from 3% to 4%. I still jump at the chance to get out and do fun things, but I’ve been more careful on the price tags of those fun things. Reducing here means increasing in areas that we’ve deemed more important.
Giving - We went from 2% to 3%. Giving back comes in the form of volunteering and donations. I’ve not only increased my hours, but I’ve also increased my dollars of support.

Fitness - This one is new this year because at the end of the year we decided to find a personal trainer. 2% of our spending went to fitness, and in 2018, it will likely be a higher percentage. We’re prioritizing our health and wellbeing, so we can spend less on those areas later in life.
And that’s our pie chart for 2017! There were big jumps in a few areas, but the general trend remains the same. While I excluded savings from this chart, it is definitely an area I’m focused on for 2018 whether it is with pre- or post-tax dollars.
Have you tracked your spending for the year? Are there areas of spending that you would like to change for the upcoming year?