
In April, I posted a spending summary for the first three months of the year. I thought it would be a better/more interesting way to stay accountable on my spending and saving goals throughout the year by looking at it quarter by quarter. Here’s what April through June looked like as a percentage of overall spending:
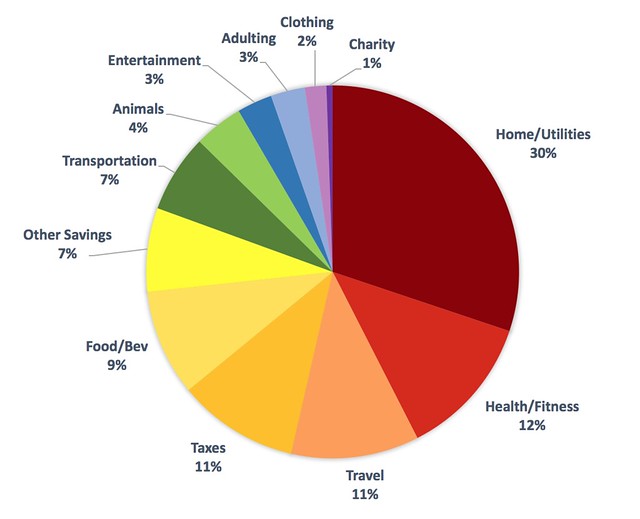
Home/Utilities (30%; Q1: 26%) - I’ve lumped mortgage, utilities and home improvement into one category. I’ve decided that going forward it doesn’t make sense to include the rental property in this analysis. So we’re just talking about all things San Francisco here. This increased from last quarter’s 26% because in April, I decided to make a one extra payment. One of the larger expenses in this quarter was fixing our garage door in April because well, it stopped working, and that’s terribly inconvenient. We ended up upgrading it, and now it’s a lot quieter.
Adulting/Taxes (14%; Q1: n/a) - I’m combining the two categories since they’re unique to this quarter. Most of the spending here is Ryan’s tax payment - yeah, it’s a huge chunk. On top of that, we met with a lawyer for estate planning and a financial advisor for a financial check-up aka “When can we retire?” this quarter. It seems we’re mostly on track. We did make a few changes here and there.

Health/Fitness (12%; Q1: 11%) - This stayed pretty consistent as a percent of our total spending. We’re still paying attention to our health, so this covers our personal trainer and our monthly Forward fee. While we have started decreasing the number of times we’re working with the trainer, we’re also finding other ways to stay in shape.
Travel (11%; Q1: 8%) - Travel went up from 8% because in addition to our normal Disneyland spend, we booked plane tickets for Iceland and rented our car for the weeklong trip. We’re going electric with Geysir, but more on that in another post! As I mentioned last quarter, the bulk of my spending for travel had been stocking up on gift cards for future travel use (examples - Airbnb, Hotels.com, Uber). I ended up cashing in on a bulk of it because we needed to book accommodations for Iceland. So so excited for the trip!
The site I use to buy gift cards is: Raise.com. If you use my referral link, we will both get $5 off when you make a purchase within 30 days of signing up.

For Ryan’s birthday, we went up to Washington to visit a wolf sanctuary!
Food/Bev (9%; Q1: 9%) - This category stayed relatively stable as a percentage of our spending. Groceries, eating out, and our wine/spirits club memberships.
Other Savings (7%; Q1: 21%) - This category represents post-tax savings, investing and in some cases, crowdfunding. In this quarter, it was mostly topping off our Roth IRAs to their maximum for the year.
Transportation (7%; Q1: 8%) - This probably won’t change much as it’s just our monthly car payment and the gas we use at home and on trips.
Entertainment (3%; Q1: 8%) - In the first quarter, we bought Legos and Broadway musicals. As expected, this went down without the same big purchases this quarter.
For those of you wondering, I am using You Need A Budget (or YNAB for short) to track everything. If you have been curious on trying it out, here’s my referral link for a one month trial. Can’t believe HALF of the year has already gone by! I think we’re in pretty good shape, and our spending is in line with our priorities, so no complaints here.
Are you tracking your spending? How are you coming along on your spending goals for the year?