
Save more, spend less. That was the theme for the third quarter. With the Q1 and Q2 spending summaries posted, I could see where I wanted to shift my spending in Q3. Having that information handy helped shape where we put our dollars between July and September:
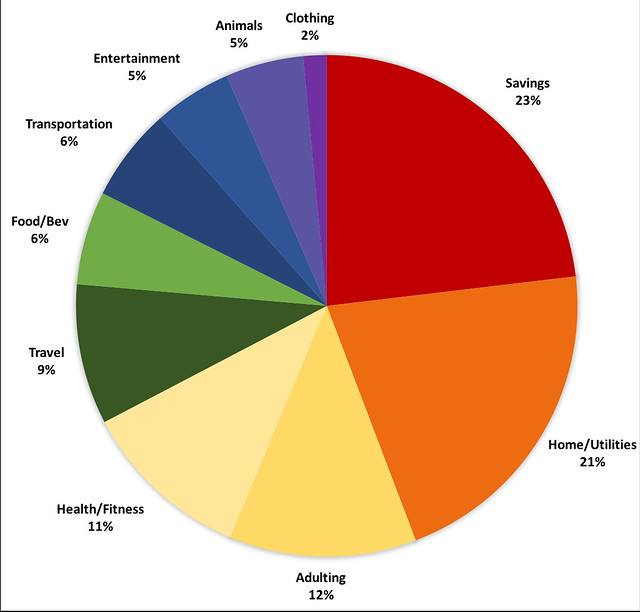
Other Savings (23%; Q2: 7%; Q1: 21%) - This category represents post-tax savings, investing and in some cases, crowdfunding. Last quarter, we topped off my Roth IRA, so this quarter, we got to Ryan’s, as well as some additional set aside in our investment account.
Home/Utilities (21%; Q2: 30%; Q1: 26%) - This category represents mortgage, utilities and home improvement. We didn’t make additional payments but did do a little work on the garage.
Adulting (12%; Q2: 14%; Q1: n/a) - The bulk of this category is related to estate planning. We made our last visit and payment this quarter, so I don’t foresee anything additional the rest of the year.

Health/Fitness (11%; Q2: 12%; Q1: 11%) - This is consistent as a percent of our total spending. Regular expenses include: our personal trainer, our gym membership, and our monthly Forward fee. This may decrease in the next quarter when we wean ourselves from the personal trainer. We haven’t pulled the plug just yet.
Travel (9%; Q2: 11%; Q1: 8%) - As mentioned previously, we’re stocking up gift cards to pay for travel accommodations. This category includes any spending while traveling, so it includes all the eating, dining and fun of our Iceland trip. I’ve also started booking parts of our November Belize trip.
The site I use to buy gift cards is: Raise.com. If you use my referral link, we will both get $5 off when you make a purchase within 30 days of signing up.

Food/Bev (6%; Q2: 9%; Q1: 9%) - This category stayed decreased as a percentage of our spending. Groceries, eating out, and our wine/spirits club memberships. It went down because we spent some time traveling, and the food-related expenses got moved to that category as a result.
Transportation (6%; Q2: 7%; Q1: 8%) - This probably won’t change much as it’s just our monthly car payment and the gas we use at home and on trips.
Entertainment (5%; Q2: 3%; Q1: 8%) - I decided to register for Alt Summit next year, so that’s the bulk of this category this quarter. There are also a few museum memberships and Broadway musicals too.
For those of you wondering, I am using You Need A Budget (or YNAB for short) to track everything. If you have been curious on trying it out, here’s my referral link for a one month trial.
Are you tracking your spending? How are you coming along on your spending goals for the year?